Creates a donut chart – a sunburst restricted to the outermost 1–N
depth levels. The centre hole is created by shifting Y coordinates
so the innermost displayed ring has ymin > 0.
Usage
donut(
  sb,
  levels = 1,
  fill = NULL,
  colour = "white",
  linewidth = 0.2,
  show_labels = FALSE,
  hole_size = 1,
  ...
)
Arguments
- sb
A
sunburst_dataobject fromsunburst_data().- levels
Number of depth levels to display (from the outermost inward).
1= single ring,2= two concentric rings.- fill
Fill mapping. Accepts bare names or strings.
NULLor"none"for static grey,"auto"for depth mapping, or a column name (bare or quoted).- colour
Border colour for segments. Default
"white".- linewidth
Border line width. Default
0.2.- show_labels
Whether to display labels. Default
FALSE.- hole_size
Size of the centre hole. Higher = larger hole relative to ring thickness. Default
1.- ...
Passed to
geom_rect().
See also
sunburst() for full sunburst plots, icicle() for
rectangular layouts.
Examples
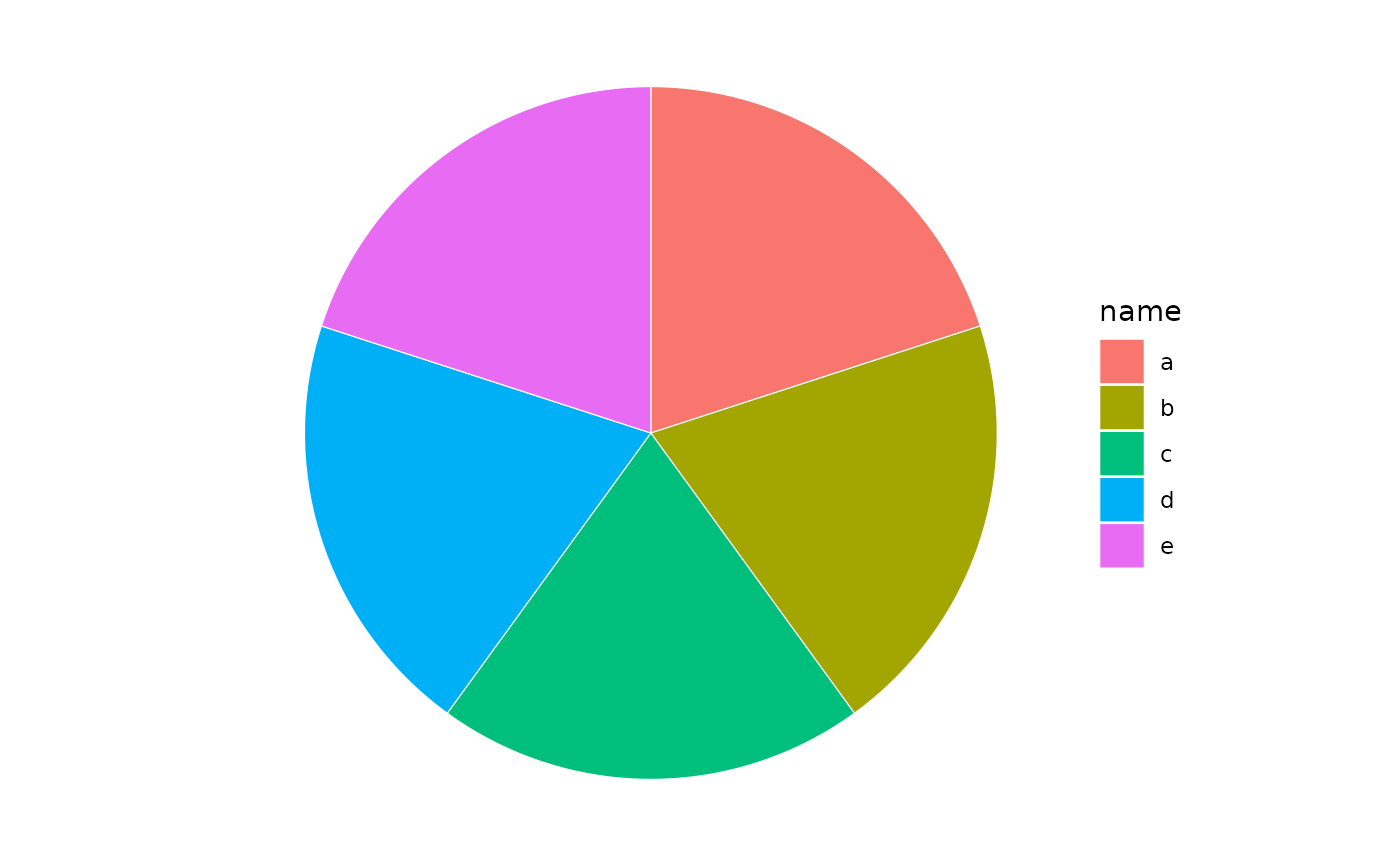
sb <- sunburst_data("((a, b, c), (d, e));")
donut(sb, fill = "name")
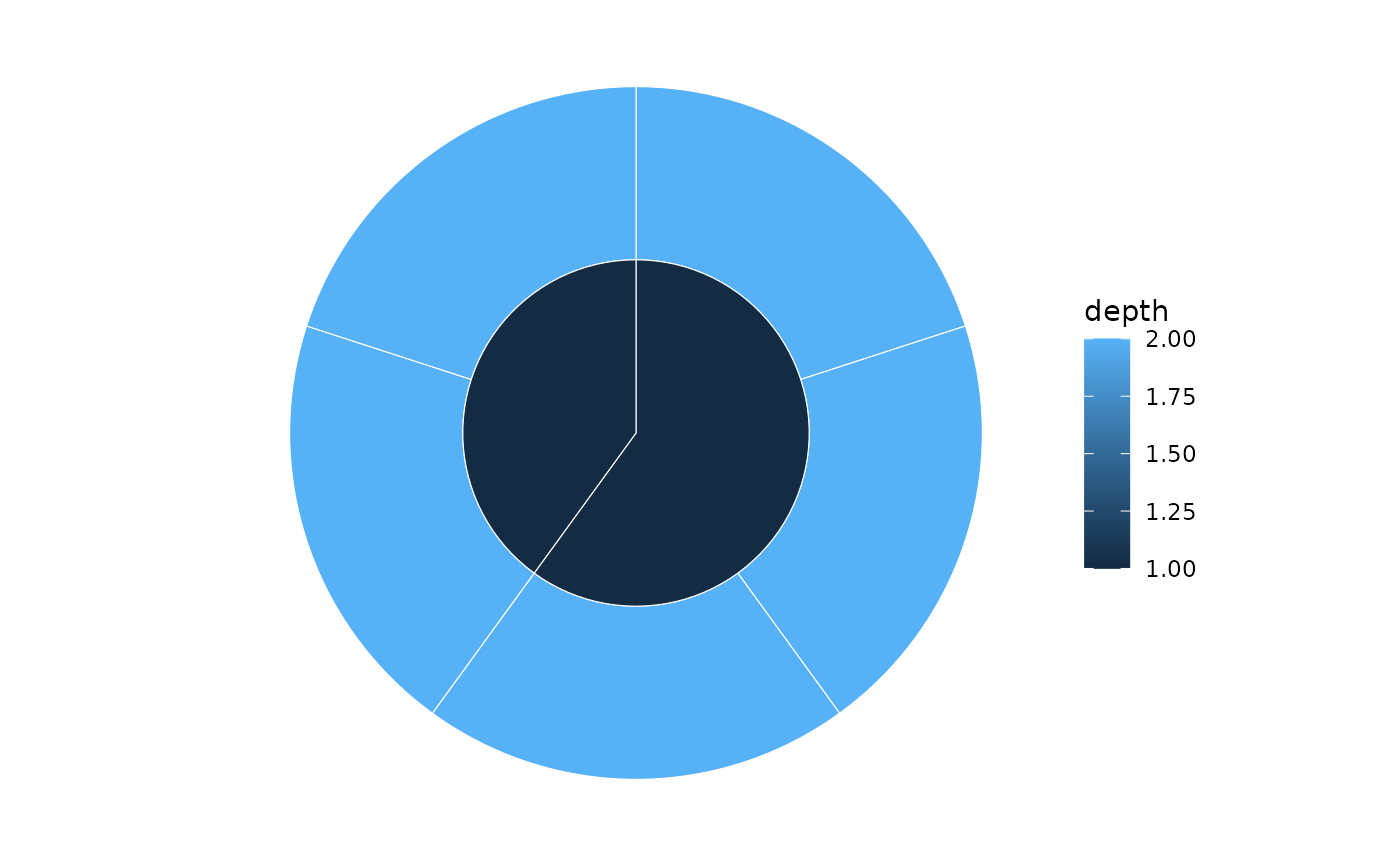
 donut(sb, levels = 2, fill = "depth")