Creates an icicle (rectangular, top-down) plot from a sunburst_data
object using ggplot2::geom_rect() with scale_y_reverse() and
theme_void().
Usage
icicle(
  sb,
  fill = NULL,
  colour = "white",
  linewidth = 0.2,
  show_labels = FALSE,
  show_node_labels = FALSE,
  label_size = 3,
  min_label_angle = 0,
  label_repel = FALSE,
  ...
)
Arguments
- sb
A
sunburst_dataobject fromsunburst_data().- fill
Fill mapping. Accepts bare names or strings. One of:
NULL(default): static grey fill (no aesthetic mapping)."auto": maps fill to thedepthcolumn."none": explicit static grey fill (same asNULL).A column name: either bare (
fill = depth) or quoted (fill = "depth"). In a future version, the default may change fromNULL(static grey) to"auto"(depth mapping). Use"none"for an explicit static grey fill that will not change.
- colour
Border colour for rectangles. Default
"white".- linewidth
Border line width. Default
0.2.- show_labels
Whether to add text labels. Default
FALSE.- show_node_labels
Whether to add text labels for internal nodes. Only takes effect when
show_labels = TRUE. DefaultFALSE.- label_size
Text size for labels. Default
3.- min_label_angle
Minimum angular extent (degrees) for a node to receive a label. Nodes with
delta_angle < min_label_angleare not labelled. Default0(no filtering).- label_repel
Use
ggrepel::geom_text_repel()for collision avoidance. Requires theggrepelpackage. DefaultFALSE.- ...
Passed to
geom_rect().
See also
sunburst_data() for data preparation, sunburst() for
polar layouts, donut() for ring charts.
Examples
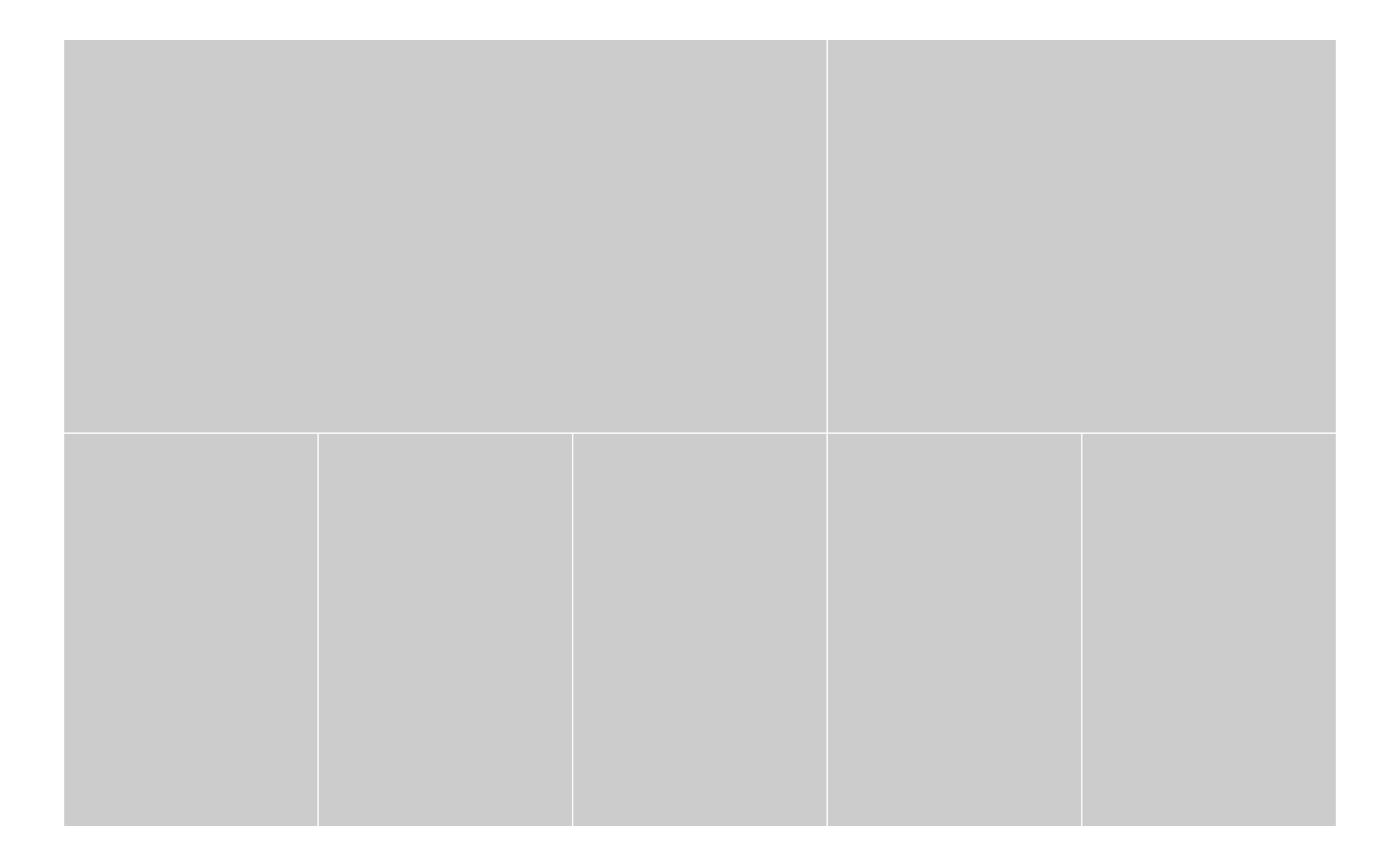
sb <- sunburst_data("((a, b, c), (d, e));")
icicle(sb)
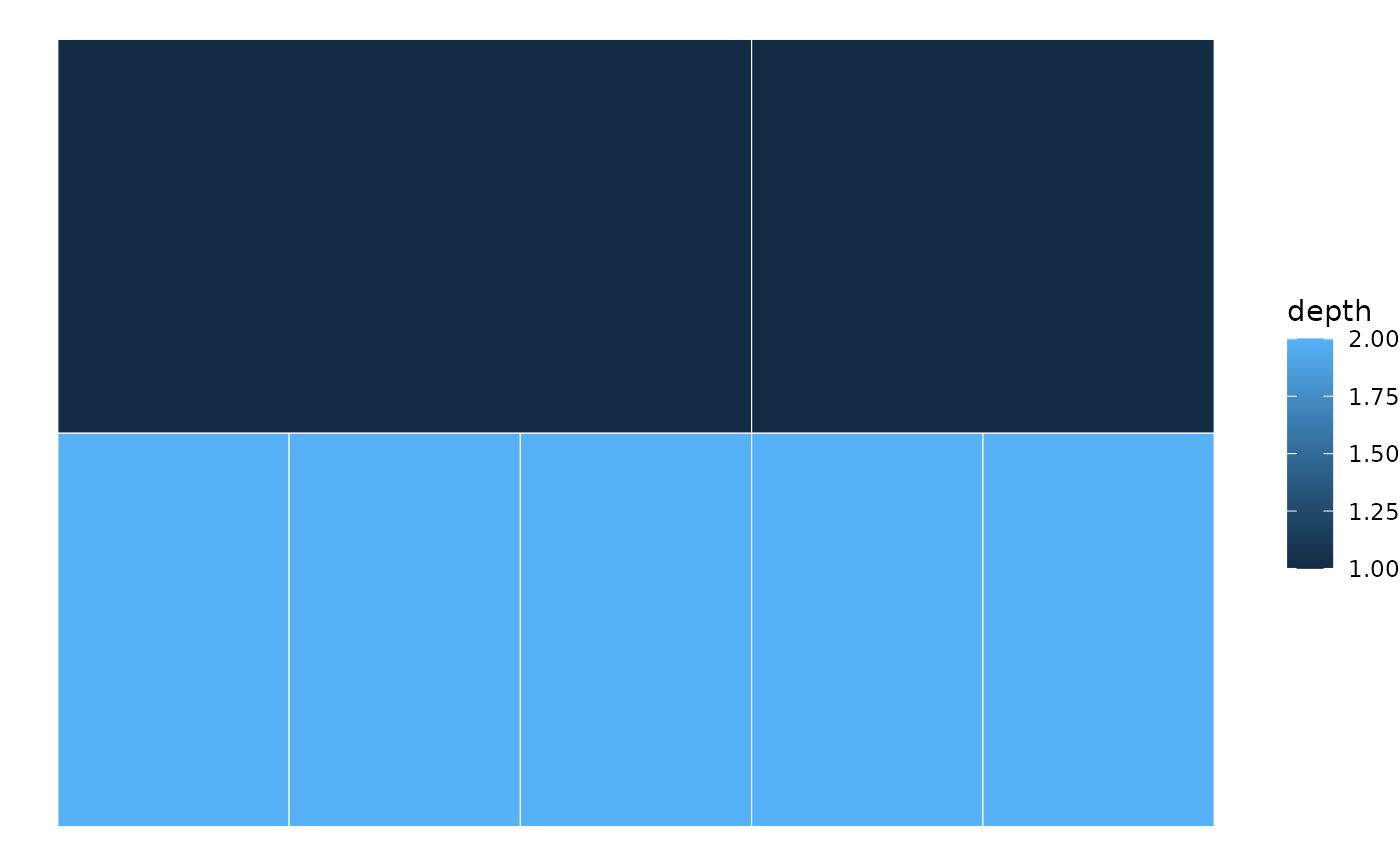
 icicle(sb, fill = "depth")
 if (FALSE) { # \dontrun{
icicle(sb, fill = "depth", show_labels = TRUE, label_repel = TRUE)
} # }
if (FALSE) { # \dontrun{
icicle(sb, fill = "depth", show_labels = TRUE, label_repel = TRUE)
} # }