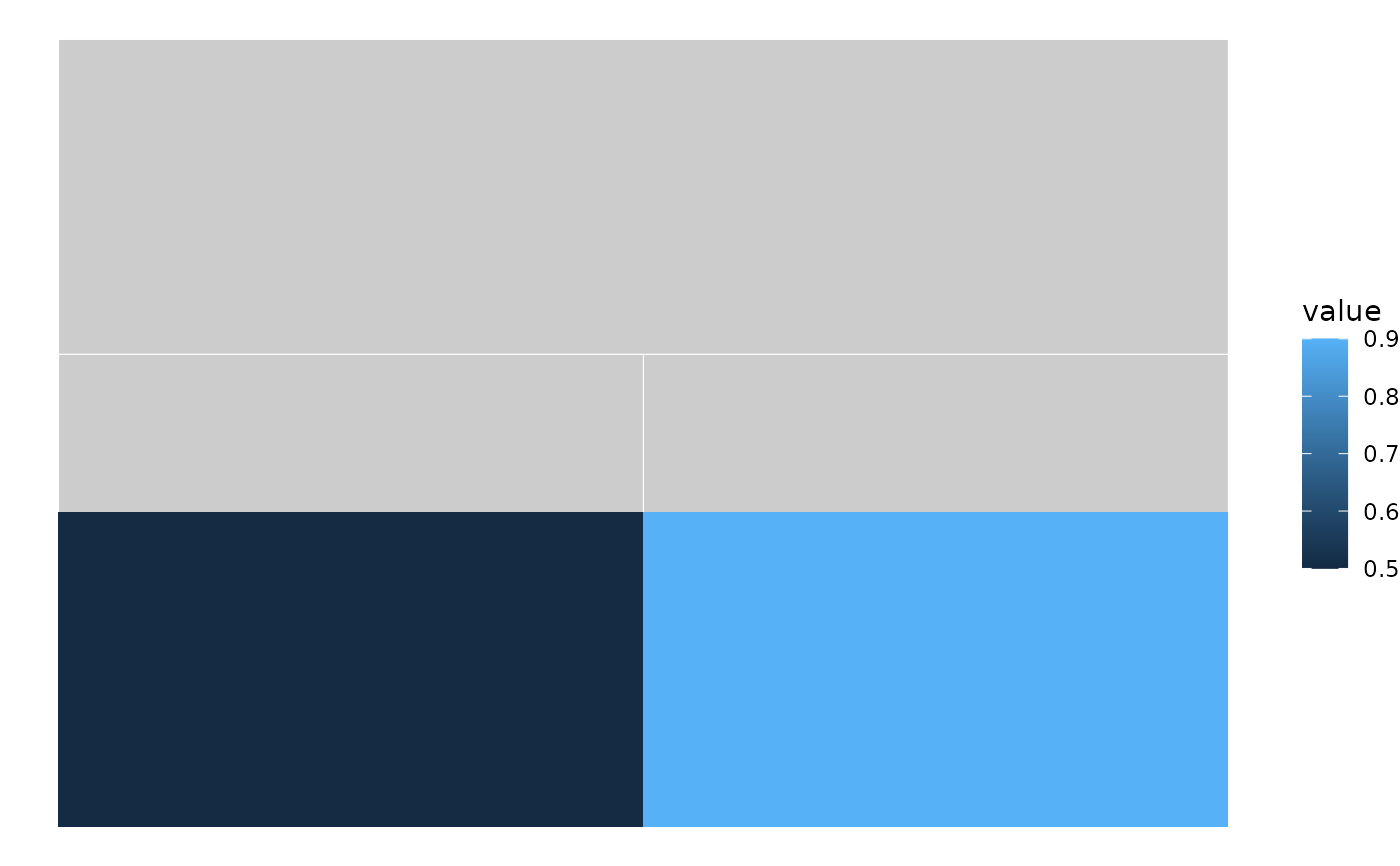
Overlays coloured tiles adjacent to leaf nodes, where each tile
represents a categorical or continuous variable from node attributes.
The fill aesthetic is mapped to the value, allowing users to add
+ scale_fill_*() after the call.
Usage
tile(
  p,
  sb,
  variables,
  y_offset = 0,
  tile_height = 1,
  tile_width = 1,
  colour = "white",
  linewidth = 0,
  show_labels = FALSE,
  label_angle = 90,
  label_size = 3,
  ...
)
Arguments
- p
A ggplot object from
sunburst(),icicle(), orggtree().- sb
The
sunburst_dataobject used to createp.- variables
Character vector of column names in
sb$rectsto display as tiles.- y_offset
Vertical offset from the outermost ring. Default
0.- tile_height
Height of each tile band. Default
1.- tile_width
Width of each tile. Default
1.- colour
Border colour for tiles. Default
"white".- linewidth
Border line width. Default
0.- show_labels
Whether to display variable names. Default
FALSE.- label_angle
Rotation angle for variable labels. Default
90.- label_size
Text size for variable labels. Default
3.- ...
Passed to
geom_tile().
Note
Since tile() maps fill to values, it will conflict with the
fill aesthetic of the base plot. Use a base plot without fill mapping
(e.g., icicle(sb)) or ggnewscale::new_scale_fill() before calling.
See also
bars() for bar chart annotations,
highlight_nodes() for node emphasis.
Examples
df <- data.frame(
  parent = c(NA, "root", "root"),
  child  = c("root", "A", "B"),
  score  = c(NA, 0.5, 0.9)
)
sb <- sunburst_data(df)
p <- icicle(sb)
tile(p, sb, variables = "score")